Local dashboard
See gateway health, protection status, and recent decisions in your browser.
Dashboard Lite is the local browser interface included with Mesh. It works with the script-installed CLI and gateway; a separate desktop app is not required.
Open the dashboard
After installing and setting up Mesh, run:
smesh dashboard opensmesh dashboard open opens Dashboard Lite at http://127.0.0.1:8080, reachable only from this computer, with a one-time access handoff:
smesh dashboard statusThe dashboard is an operational view. Use the CLI commands to change policies or connect clients.
What you can see
| Panel | What it tells you |
|---|---|
| Gateway health | Whether the gateway reports healthy or unavailable. |
| Selected policy | The active policy profile and file-handling mode. |
| Protected and unprotected clients | Clients with a reported protection state. Configuration alone does not establish protection; idle or unknown clients should not be treated as protected. |
| Decision counts and verdicts | Allowed, warned, redacted, and blocked decisions within the selected history window. |
| Inspections over time | Request inspection activity over time. Point to or select a bar to inspect its time and count. |
| Recent decisions | Timestamps, verdicts, scan state, provider/client identifiers, and matched rule identifiers. |
| Top rules | The most frequently matched detection rules in the available records. |
| Mesh vs provider latency | Separate scan and provider timing percentiles, with sample counts, when stage-timing records are available. Missing measurements appear as dashes. |
| Inspection coverage | Scanned decisions and decisions where inspection did not complete, including available reasons. |
| Additional metadata | Team identifiers, event types, classification labels, and last audit activity when those fields are available. |
Example dashboard
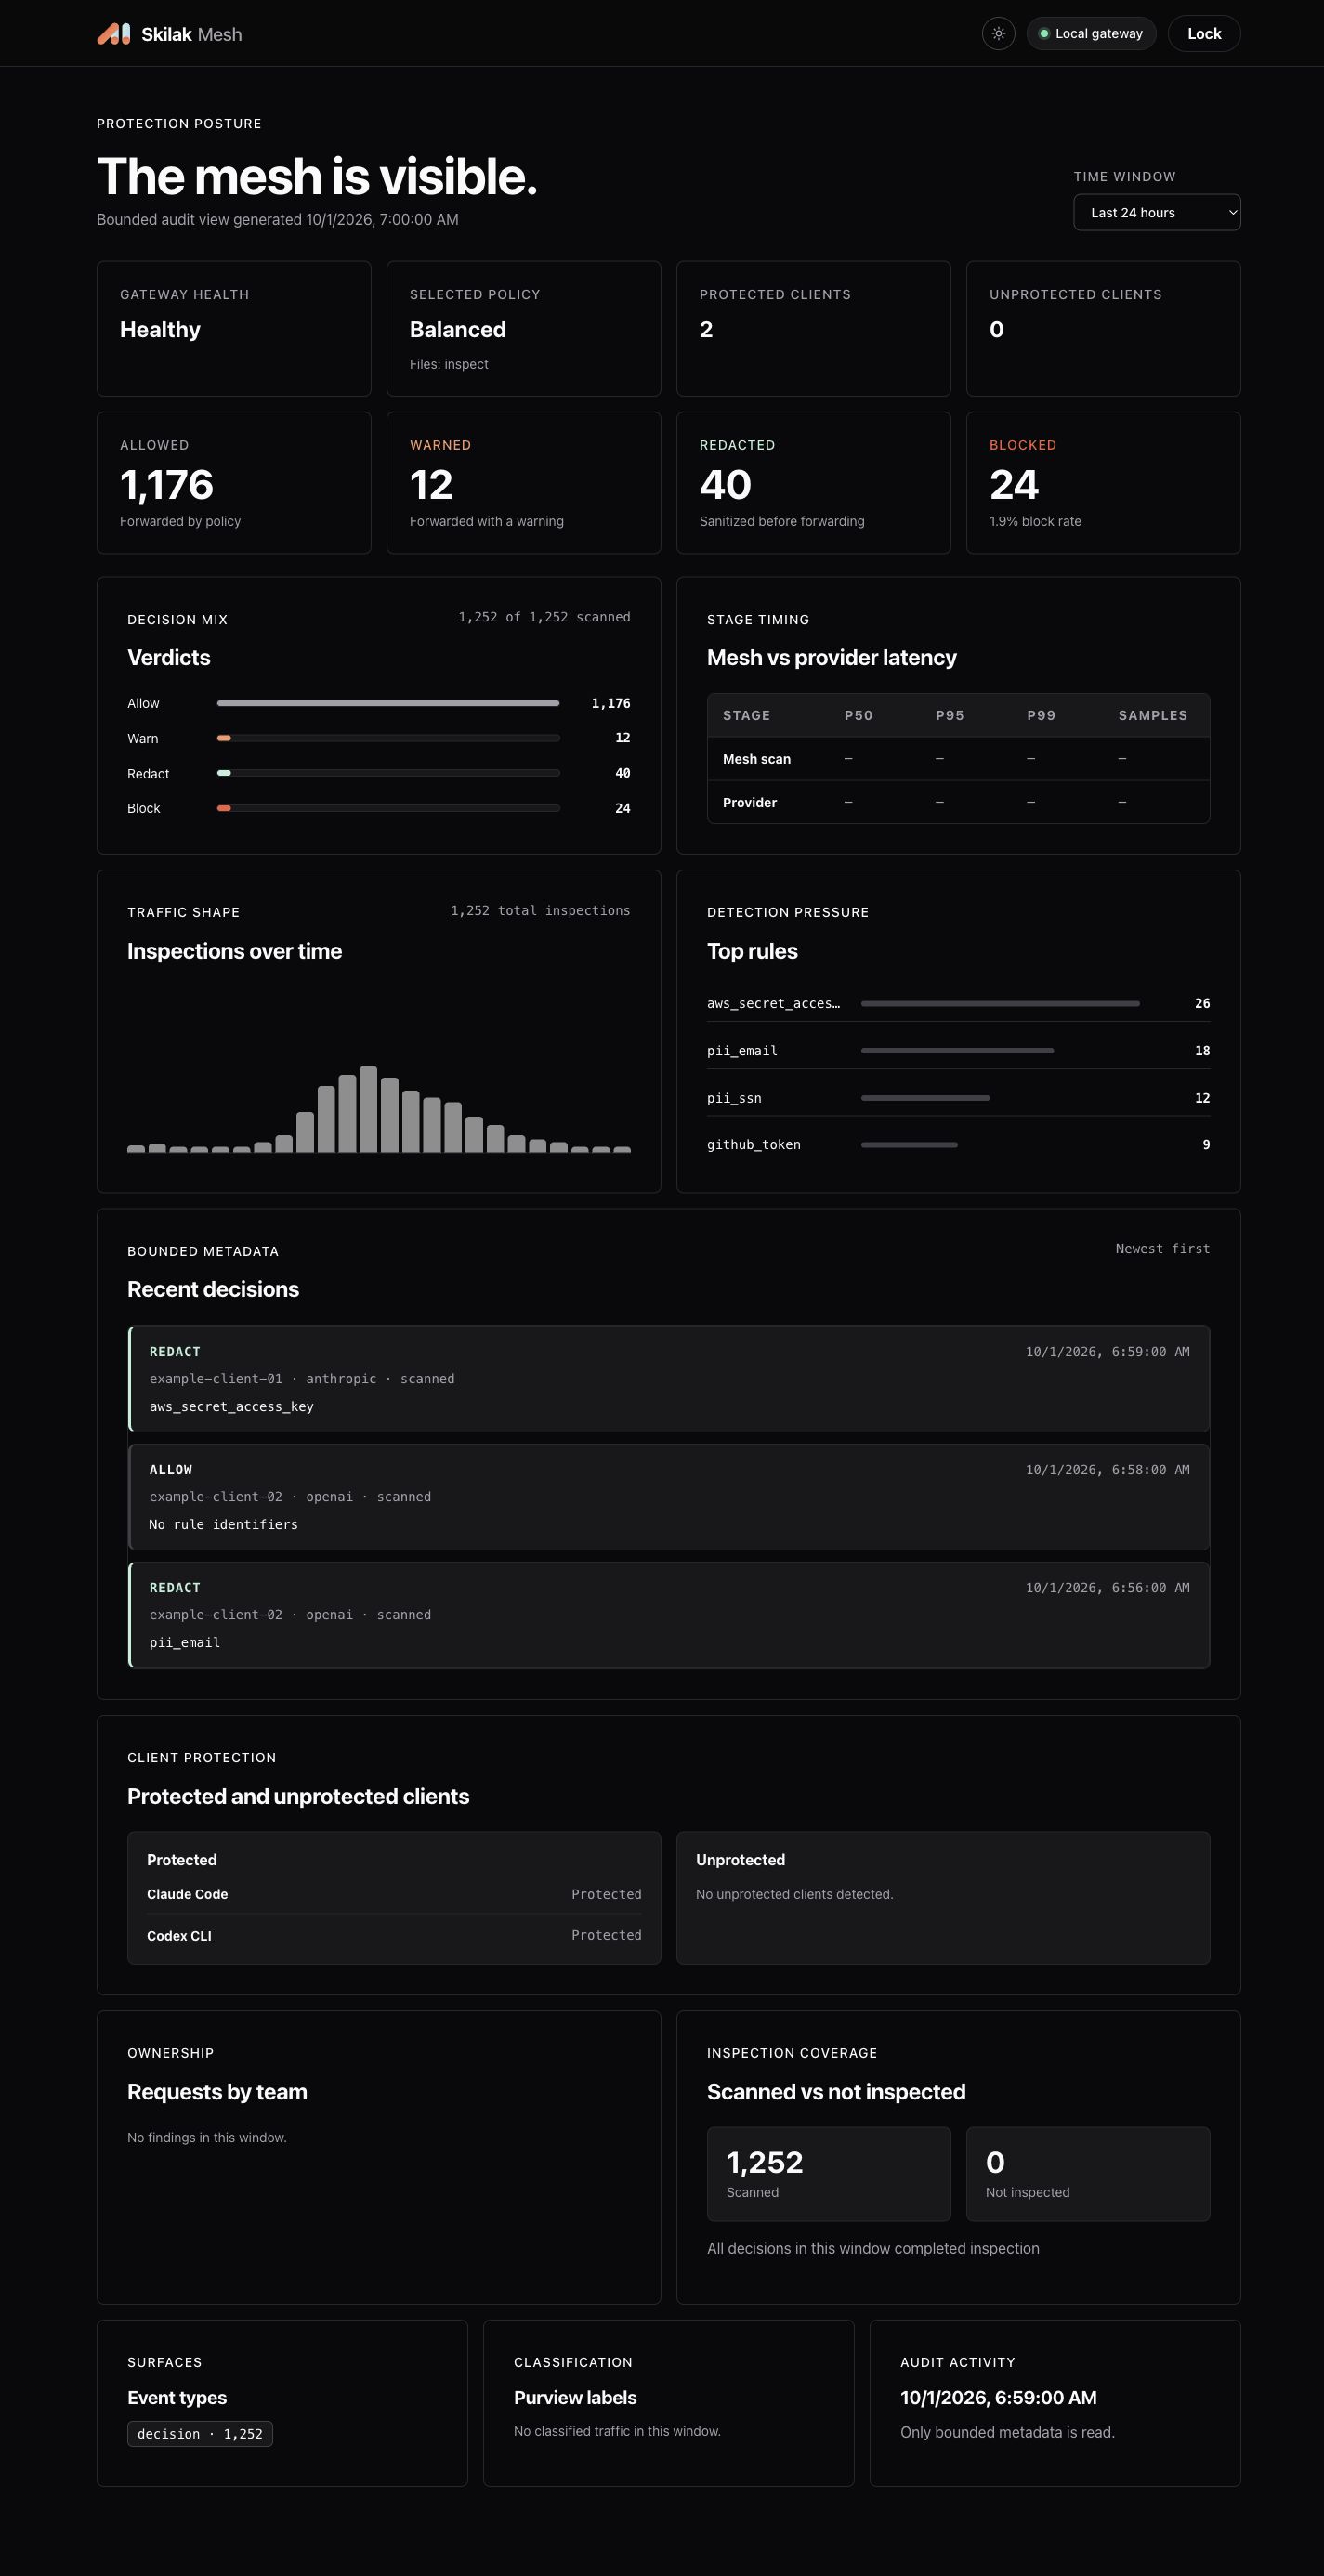
The screenshot uses the current Mesh dashboard with synthetic example data. Counts illustrate the interface; the empty latency fields are not performance measurements. Open the image to see all panels.
Read the history correctly
Choose the last hour, 24 hours, seven days, 30 days, or available history. Changing the window refreshes the view. It uses a bounded local audit history; a selected window does not guarantee that every historical record is retained or included.
The dashboard describes requests routed through Mesh. It does not prove that all applications or all network traffic use the gateway. A healthy service also does not establish that an idle client has recently sent inspected traffic.
What stays private
The dashboard displays operational metadata rather than request content. It excludes prompts, matched secret values, credentials, file contents, hashes, and request identifiers from its audit view. Access stays in the browser tab, and the dashboard binds to your own computer by default.
If the view is unavailable
Run smesh dashboard open again to open a fresh link. Run smesh status and smesh doctor to check the gateway and your installation. If the gateway is stopped, use smesh start and check its status again. You can also run smesh dashboard status to inspect the reported state.
Still stuck? Report an issue. Never paste secrets, prompts or file contents.
See Operate Mesh for maintenance, the CLI guide for common commands, and smesh on GitHub for the public repository.